
Note: It was announced in November 2023 that MoneyOwl will be acquired by Temasek Trust to serve communities under a re-purposed model, and will move away from direct sale of financial products. The article is retained with original information relevant as at the date of the article only, and any mention of products or promotions is retained for reference purposes only.
______________
A lot can happen in a year. Looking back at how 2018 ended, it was hard to be extremely bullish headed into 2019, yet as it turns out, extreme bullishness is what gripped both stock and bond market investors over the course of the year.
The US stock market fell almost 20% towards the end of 2018, (down 19.8% to be exact), as the 4th quarter of 2018 saw the trade war between the US and China intensify as the US implemented 10% tariffs on $200 billion of Chinese imports. Trade jitters and the prospect of slowing economic growth due to the Fed raising rates led to a sharp selloff in stocks.
Fast forward a year later, and instead, we are looking at US stocks having their best performance in 6 years, with the S&P 500 rising 29% over 2019. (In 2013 the S&P 500 rose 29.6%). Alongside the stock rally, bonds also had a spectacular year, with the Bloomberg Barclays Global Aggregate Index (USD Hedged) returning 8.22%. Global Stocks were no slouches, as both Europe and Japan rallied alongside the US, propelling the MSCI World Index to a return of 27.7%. Emerging Markets recovered from a difficult 2018 by rising 18.4% in 2019. The local STI Index also delivered positive returns, up 9.4% on a total return basis for 2019 (in SGD).
MoneyOwl incepted our portfolios on Apr 24th, 2019. The charts below show the performance of the 3 funds in our portfolio from Apr 24th to Dec 31st, 2019 (In SGD terms).
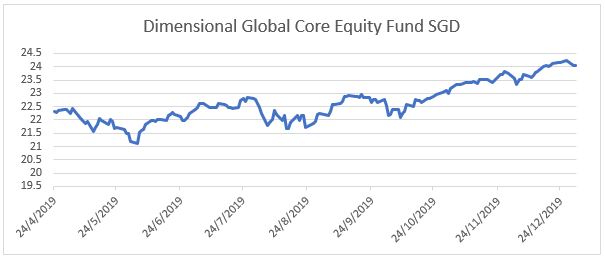
Dimensional Global Core Equity Fund SGD: +7.8%
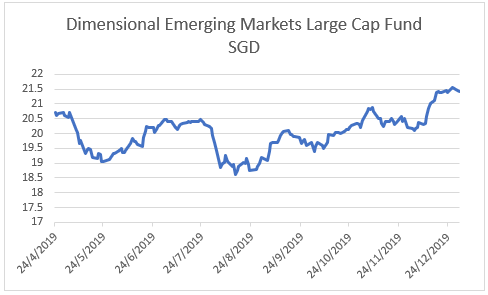
Dimensional Emerging Markets Large Cap Fund SGD: +3.5%
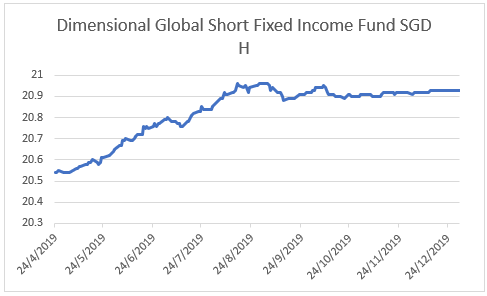
Dimensional Global Short Fixed Income Fund SGD H: +1.9%
Please note that the numbers shown are not full-year performance, so they cannot be compared directly to the 2019 performance numbers of the broad indexes. As a comparison, the total return of the STI Index from 24 Apr to 31 Dec 2019 is -0.79%.
What happened in 2019 to reverse all the pessimism? For one, the Fed reversed course quickly, and instead of continuing to raise rates, the Fed cut rates over 2019 instead. Instead of intensifying the trade war, the US and China worked towards a truce, negotiating over the course of the year to eventually reach a phase one deal that is scheduled to be signed in Jan 2020. While economic growth slowed, recession was avoided. Singapore’s extremely trade-dependent economy still managed a 0.7% growth in 2019.
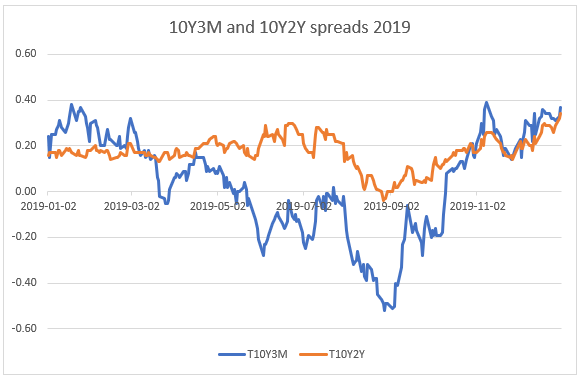
In fact, even a period of inversion for the yield curve was not able to knock the market off its stride. The 3-month T-bill yield rose above the 10-year treasury yield in March and the 2-year and 10-year spread also experienced a brief period of inversion in August. After a brief pause, markets resumed their upward climb even though many news headlines were discussing the negative implications as a yield curve inversion has preceded every US recession since 1975. While inversion of the yield curve does signal economic imbalance, the recession can happen much later (in many cases 2-3 years later) and it does not predict the severity of the recession nor does it predict the severity of the market correction (if any). Using yield curves to time the market is unlikely to be a successful strategy, as most of the time the market comes down after the period of inversion is over. As seen in the chart below, the curves have returned to normal towards the end of 2019.
When we think back to the end of 2018 and the start of 2019, everything felt very uncertain. There had been a decade-long economic expansion since the GFC in 2008. Stock markets had risen to historic highs, and then suddenly fell 20%. Was it the start of a bear market? Thankfully it was not the case.
The point we are trying to make though is that there is always uncertainty in investing. When we present the standard deviation of stocks or funds, we are trying to highlight that there is a variance around the expected return of the asset class. While historical data has shown that the expected return is positive, there is also a probability that there will be uncertainty around the expected return (expressed as a range of probable returns through the standard deviation). After all, as 2019 has shown, uncertainty can lead to positive outcomes, not just negative ones.
Who could have predicted that instead of rate hikes (2 hikes were forecast for 2019 after the last FOMC in 2018) we would get 3 rate cuts in 2019? The Fed fund rate was projected to reach 3% in 2019 but finished the year at 1.75%. Or could have anticipated a thawing of trade tensions over the course of 2019. Even as late as August 2019, the US announced 10% additional tariffs on $300 billion worth of Chinese imports, with China retaliating by halting purchases of US agricultural products. Most investors didn’t expect either event to happen, so when they did happen, bond yields fell, and stock prices rose as prices adjusted to reflect the new reality.
How should we deal with the uncertainty in investing then? There are 3 key points to keep in mind when investing that can help you navigate the uncertainty.
1. Make sure you know the time horizon for your investment plan
Global stocks were up 22.4% in 2017, down 8.7% in 2018, and up 27.7% in 2019. This translates into an annualised return of 12.59% over 3 years, which is a lot closer to the 9% annualised return of global stocks since 1970. At the end of 2018, it did not feel like stocks were an asset class that returned 9%, and in 2019 it feels like stocks return far more than 9%. Yet over time, the historical data shows us that global stocks are likely to give us a positive expected return of around 9%. How does this help deal with the uncertainty? Understanding that the year to year fluctuations of the stock market are short term events, and keeping in mind the longer-term return profile of the asset class with help you avoid making an investment decision based on short term information, such as selling out of your stock portfolio at the end of 2018 and missing out on the stellar returns in 2019.
2. Remember that your investment is in real companies
It is easy to get lost in a list of fund names and symbols, of return and risk metrics and just wonder what exactly you are holding in your portfolio. When the market is coming off, it is reflecting the short-term changes in a company’s value, but longer-term, the economic output of all the companies in your portfolio will be reflected in the stock price over time. Think back to late 2018. Despite the uncertainty in the stock market, did you stop paying your mobile phone subscription? Or stop visiting the supermarket for groceries? Stop your television subscription or your internet subscription? Or stopped using public transport? Or stop using the banks? Maybe you looked for cheaper alternatives, which might have benefited some companies at the expense of others, but overall, as long as companies are delivering value to consumers, there will be demand for products and this drives company profits and shareholder returns. For example, Dairy Farm (owner of Cold Storage, Giant, and Guardian), Sheng Siong, Singtel, Starhub, SBS Transit, Comfort Delgro, Breadtalk, DBS, OCBC and UOB are all in our portfolio, not to mention Nestle (maker of Milo and Maggi Mee and Nespresso), Unilever (Dove shampoo, Ben & Jerry’s Ice cream, and Magnum ice cream) Mcdonalds and Starbucks, and the FAANGs of course. It is very likely that regardless of the market situation, you are consuming a product from one or more of these companies regularly.
3. Diversification protects you on the downside and helps you capture upside
Diversification helps you deal with uncertainty when markets are going down, as it helps ensure that even if certain companies in your portfolio do badly, they do not makeup too large a position to cause a serious impact on the returns. For example, if you are holding a portfolio with 8000 stocks evenly allocated each position is 0.0125% of the portfolio. A 20% fall in the price of one of the stocks will only impact your portfolio by 0.0025%. That’s $25 of $1,000,000.
On the other hand, being diversified ensures that you are holding the best-performing stocks for any time period. Uncertainty does not just mean bad news. There is also uncertainty around which are going to be the best stocks to hold at any period. Companies launch exciting new products all the time, but which ones will be a success? Nobody knows for sure. We can make an informed guess, but that is still not 100% certainty. Why is this important? Because the data shows that the top-performing stocks have an outsized impact on returns in any given year.
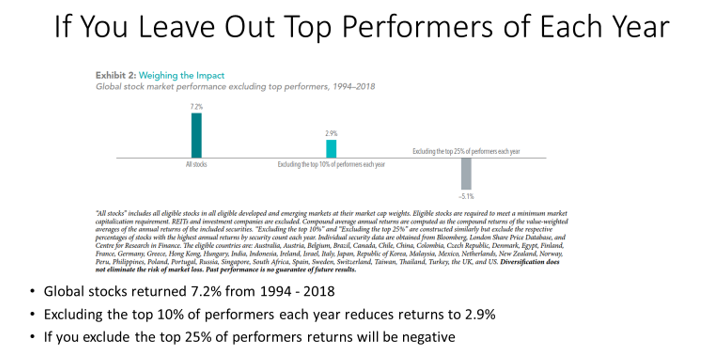
In order to improve your returns, you also need to diversify! Case in point, in 2019, Apple and Microsoft accounted for 14.8% of the S&P 500 Index’s return. 2 companies contributed to 15% of the 29% return this year. Not having MSFT and AAPL in your portfolio would have resulted in 4.35% less performance.
As we head into 2020 and the new decade, there will no doubt be new challenges that will make the future uncertain. Do try to keep the few points in mind when trying to make a decision regarding your investment portfolio, and remember that throughout history, there have always been challenges but despite this, stocks have still delivered a positive expected return. As the founder of Dimensional Fund Advisors David Booth said in a recent New York Times article on the futility of market forecasts, “do better things with your life than worrying about where the market is going.”
Do approach your friendly MoneyOwl advisor if you have any concerns and questions!
This article was contributed by MoneyOwl’s Solutions Team.