Note: It was announced in November 2023 that MoneyOwl will be acquired by Temasek Trust to serve communities under a re-purposed model, and will move away from direct sale of financial products. The article is retained with original information relevant as at the date of the article only, and any mention of products or promotions is retained for reference purposes only.
______________
Yield curve has been used to predict the stock market crash, but does it really help?
Many investors enjoy predicting when the next stock market crash is going to occur. So anything that can apparently predict such a crash is often sought after by investors—much like adventurers used to search for the mythical Holy Grail. One stock crash indicator that has risen in popularity in recent years is known as the yield curve. But what is the yield curve and does it really help to predict stock market crashes? That’s what we will look to explore in this article.
What is the yield curve?
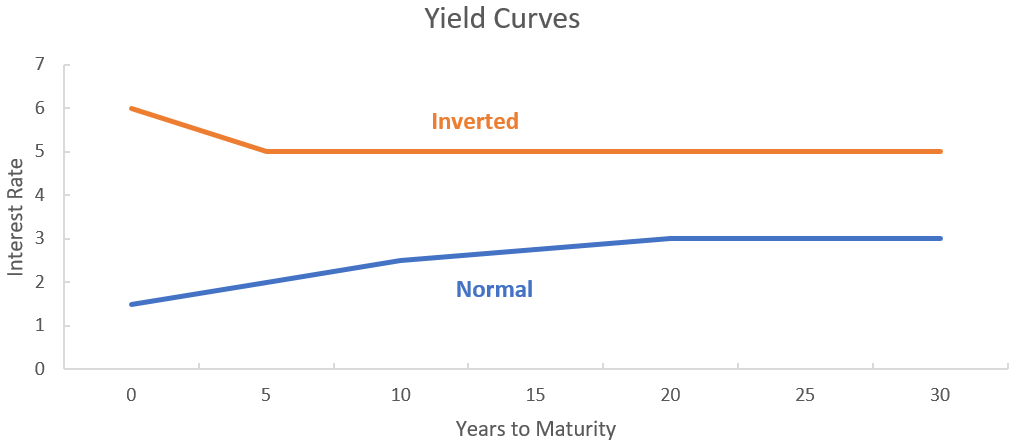
The yield curve is basically a chart of U.S. government bonds of different maturities ranging from three months to thirty years. Normally, because bonds with shorter maturities have a lower yield than bonds with longer maturities, if you plot a chart from shorter to longer maturities then the chart has an upward slope from left to right.
However, at times the bonds with shorter maturities can have higher yields than bonds with longer maturities. On 22 March 2019, the yield on 3-month U.S. government treasury bills was higher than the yield on 10-year government bonds, for the first time since the Global Financial Crisis. The yield on the 2-year bonds was less than 0.12% lower than the 10-year. In such a situation, then the yield curve is considered to be inverted (based on the 3-month versus 10-year yields), and it has been suggested that when this inversion occurs then a recession and also a stock market crash is imminent. The recent yield curve movement is due to heavy buying of US bonds after the U.S. Central Bank lowered its growth projections and officials signalled that there will be no more interest rate hikes in 2019 (compared to an expectation of two hikes at their December meeting).
Most investors use the 2-year government bond yield as the short-dated bond, and the 10-year government bond as the longer-dated bond to observe this inversion, so we shall use them in our study. Now let’s examine the evidence to see if the yield curve is indeed a reliable predictor of stock market crashes.
So does it really work?
In the chart below, the grey vertical bars show when the yield curve began to invert. Whenever the orange line is above 0%, it means that the yield curve is normal and not inverted, and when the orange line is below 0%, it means that the curve is inverted. The blue line is the value of an investor’s portfolio if he had invested $1,000 in June 1976.
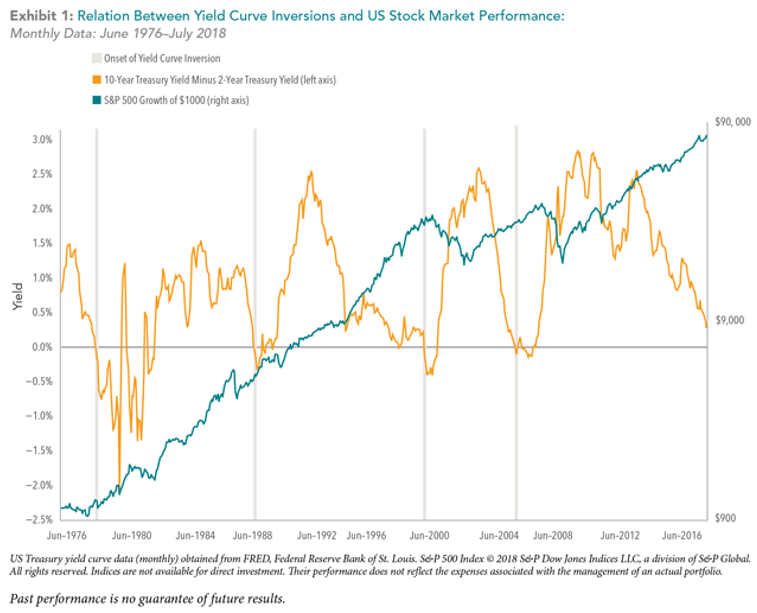
Source: Dimensional Fund Advisors
Investor Tom
Let’s imagine that an investor named Tom invests $1,000 into the stock market in June 1976. He then decides to go to the beach and sip piña coladas every day for the next 42 years, leaving the $1,000 he put into the stock market well alone. He sees something about a yield curve mentioned in the newspapers, but the only curves he has any real interest in belong to the ladies on the beach. Fast forward to July 2018 and this beach-bum strategy has allowed Tom’s stock portfolio to grow from $1,000 to about $90,000 as seen from the blue line in the chart above.
Investor Jerry
Now let’s imagine another investor, Jerry, who also invests $1,000 into the stock market at the same time. While sipping on his piña colada at the same beach, Jerry happens to read the same article written in the newspapers about how the yield curve has inverted and it is time to sell everything and hold cash. Jerry is worried that the financial expert who wrote the article might be right and follows his advice on the yield curve, selling his stocks and holding cash as recommended.
Over the next 42 years, Jerry goes in and out of the market repeatedly, depending on whether the yield curve is positive or negative. There were occasions when he got out of the market expecting a crash which didn’t come till many years later—which made him miss out on large gains—and other times when he got into the market just before the market started to decline. Looking back at how the market did on the whole over this entire period, he realizes that he would have enjoyed a far higher return had he just stayed invested through it all. He would also have been a lot less stressed, and would have been able to better focus on other things in life that he was more passionate about, such as traveling and spending time with his family.
A Possible Counter Argument
Some people may argue that every significant stock market crash has been preceded by the yield curve inverting, and that you could just use the yield curve indicator to tell you when to get out of the market, even if it does not tell you when to get back in. Let’s see if this claim is indeed true.
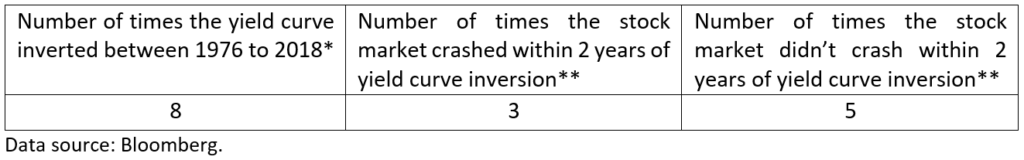
*Excludes inversions with negative yield curve spreads (U.S. 10Y minus U.S. 2Y Treasury Yields) that do not exceed -10bps before turning positive again. If the yield curve spread turns positive before inverting, and the positive spread is less than +10bps, the subsequent inversion is also excluded. This removes a large number of inversions that may be deemed to be insignificant.
**A stock market crash is defined in this instance as a bear market—meaning a decline of 20% or more.
Conclusion
As seen from the table above, the stock market only crashed three out of eight times (less than 50%) within two years of the yield curve inverting. It can take many years before the market actually crashes, which, if I may suggest, makes it a rather unreliable indicator. Even a broken clock will tell you the correct time if you wait long enough.
And so, in matters of investing—even if perhaps not in too many other endeavours in life—it appears that being a beach-bum can be both relaxing and profitable. So just invest in a cost-efficient, diversified portfolio, sit back on that deck chair, and relax. Your portfolio may ebb and flow like the waves before you, but over the long run, you’ll be able to have your piña colada and drink it too.
This article was written by the Solutions Teams of MoneyOwl and Providend. MoneyOwl and Providend are associate companies and share a similar investment and financial planning philosophy. If you need more information about insurance plans, or financial advice feel free to reach out to friendly Client Advisers here.
Announcement: With effect from 1 June 2022, MoneyOwl is a 100% NTUC Enterprise (NE)-owned company.