

Two weeks ago, a young client, Mr. Chen, asked me, why doesn’t MoneyOwl sell Dimensional’s outperformance more often? Quoting an article from an overseas financial services firm, he was excited that “every DFA U.S. equity fund that existed when the new millennium began has since outgained the S&P 500.”[1] I sensed a tinge of exasperation in his question, that we are really bad at selling! More of that later. I promised him to write something for everyone, so here it is.
In both 2021 and 2022, Dimensional equities funds outperformed their market indices, mainly because of the outperformance of value stocks. Dimensional buys more of such cheaper stocks, whereas the broad market indices have more of the expensive growth stocks, especially technology stocks. Prior to 2021, the value premium was pronounced dead by many investors, because of the huge run-up by the technology giants over a decade or so. Those were the days when it seemed like technology’s rise would never end! But technology stocks soon got brutally whacked down in double-digit percentages, especially in 2022, by the headwinds of inflation, interest rate increases and other factors. Value, by comparison, was more resilient.
In January 2023, market sentiment improved, and stocks mounted a decent recovery, led by the most beaten-down technology stocks. I wondered, would there be a reversal of the value premium, and along with that, Dimensional’s relative fortunes? Does value outperform more on the way down than on the way up?
But Dimensional continued to outperform and rode on the upper end of this wave up. Dimensional’s Core Global Equity Fund (USD) continued to outperform with a strong 7.67% return in January, beating both the broad MSCI World Index and the S&P 500.[2] This is despite value doing poorly – looking just at developed markets and in USD, the MSCI World Value index underperformed its growth counterpart by more than four percentage points in January. For MoneyOwl, our SGD Dimensional equity portfolio, comprising both developed and emerging market equities, returned 5.72%, also beating its benchmark.[3](Returns in SGD terms are lower due to currency movement, not anything else.)
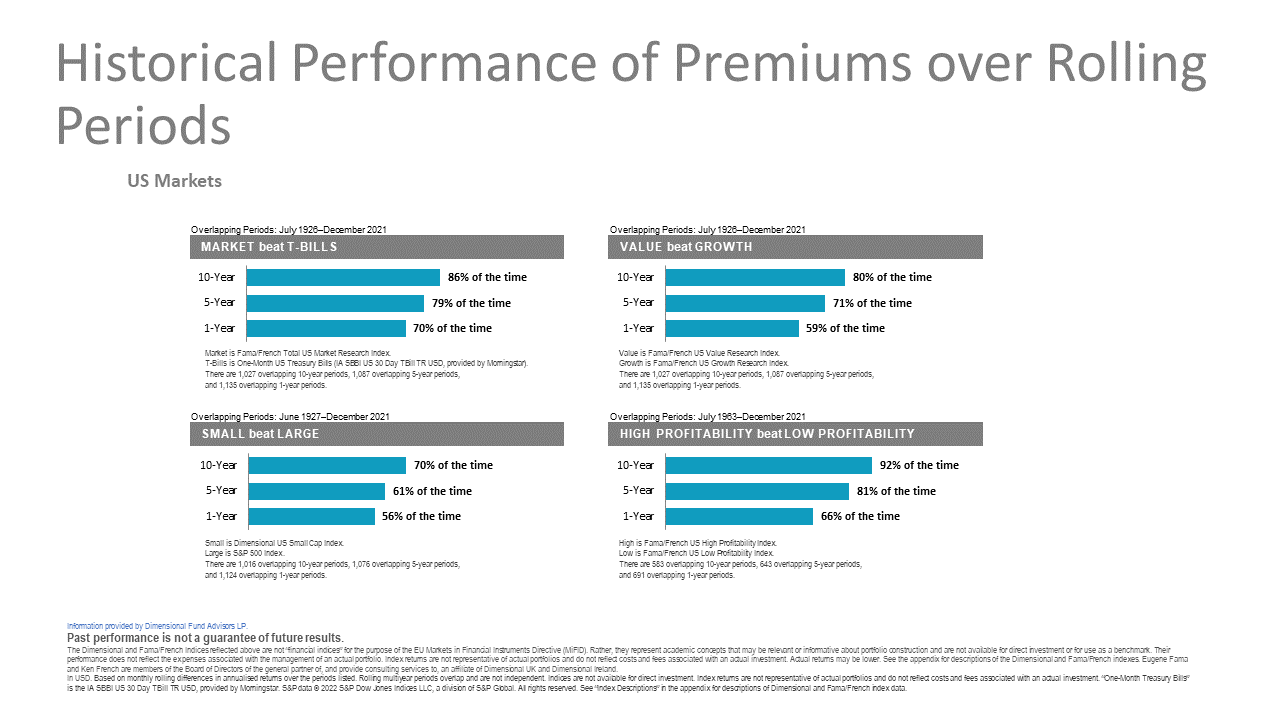
Why is Dimensional capable of outperforming the market even when the tide turns against value? The reason is that Dimensional does not tilt only towards one dimension. It also favours small caps over large caps (size premium) and high profitability over low profitability (profitability premium). In January, the outperformance was driven by small caps as well as profitability. In fact, even in 2020 and 2021, all three premiums were positive, though the attention was mainly on the resurrection of value. It’s “small is beautiful” meeting “cheap and good”! To switch to another analogy, perhaps it is like MoneyOwl sister company NTUC FairPrice’s small-packet, yumminess-loaded house brand potato chips, with ingredients sourced from around the world?
With Dimensional, therefore, there are three engines of potential outperformance: value, size and profitability, and not just one. These dimensions of higher expected returns are not just a fad. They have been rigorously researched and are backed by Nobel prize-winning financial science. To qualify as dimensions, they must be sensible, supported by valuation logic; have been observed to be persistent, pervasive, and robust; and are cost-effective to harvest. It is science and evidence-based. Dimensional is not wedded to a small group of securities picked out by analysts who may not get it right but systematically harvests those premiums from a diversified universe of stocks who display those qualities. MoneyOwl’s Dimensional equities portfolio has over 8,000 stocks without having to pay for expensive analysts as in traditional fund houses. Many traditional active funds are expensive because of this, even after taking into account trailer commission rebates that may be offered by some start-ups – just check the fund’s net Total Expense Ratio (TER) against our Dimensional equity portfolio’s 0.27% p.a. trailer-free TER. Interestingly, some of the beaten-down technology stocks have now fallen into the value territory, making them also investment candidates!
MoneyOwl shares Dimensional’s ethos in setting a high bar of logic and evidence before we admit any fund into our solution sets for clients. We do not proliferate funds to build up a colourful candy shop around the core offerings to attract business. MoneyOwl uses only market-based equity funds: Dimensional for our core wealth accumulation portfolios (cash and SRS); passive global equity ETFs wrapped in the global equities sleeve of our co-created Fullerton MoneyOwl WiseIncome retirement income portfolio (cash and SRS); and passive Vanguard equities wrapped in the adviser retrocession-free share class we had co-created with Lion Global Investors of our CPF Investment portfolio (CPF only). I totally agree with the author of the article sent by Mr. Chen, that both Dimensional and passive equities, like the Vanguard equities funds, are excellent and proven solutions.
The reason we restrict our offerings to market-based funds is simple: only market-based funds provide the highest reliability in getting a good, above-inflation long-term return for disciplined investors, at a low cost. They do not depend on the guesswork of forecasting, market-timing or stock-picking. Even if you can overcome some of the cost problems, the track record of such active management just isn’t good. The majority of these funds do not beat the market, and those who do it in any single time period, don’t manage to outperform consistently.
Given so, the superior long-term track record of Dimensional US equity funds versus the large-cap S&P 500, as analysed by the author, is indeed quite impressive. If we broaden this to include the track record of Dimensional US funds against industry active funds in terms of outperformance and also survivorship, the difference would be even more stark.
So, why don’t we sell Dimensional’s outperformance more? The short reply I gave to Mr. Chen was: we just aren’t very salesy! The long form is this: it is in our DNA, and also our mandate and constraints as a social enterprise, to be very careful about the impact of what we say and what we promise. Dimensional shares this conservatism, and that’s why we can only refer you to a third-party research and not Dimensional’s own presentations of relative returns at this point. As bad as it might be for business, we don’t really want clients to just jump onto the bandwagon too quickly because of the lure of higher returns alone. It is important that clients buy into MoneyOwl’s recommendation of choosing long-term sufficiency and reliability of returns over short-term maximisation and also understand and embrace the philosophy behind evidence and market-based investing. It is our fiduciary duty as advisers, and especially as a social enterprise, to help our clients get into this winning mindset and then to help them implement a sound, comprehensive financial plan.
To quote Nobel laureate Eugene Fama, a founding Director at Dimensional, Dimensional is “looking for what will stand up over a long period of time”. Similarly, it is only with an enduring and sound philosophy on money that your financial plan can stand up over a long period of time. No matter where you are in your life journey, I hope that MoneyOwl can play a role in living your best possible life through a comprehensive financial plan and advice on best-in-class, best-for-you solutions.

Footnotes
[1] See “Dimensional vs. Vanguard” by Sam Instone, CEO of AES UK, at https://www.aesinternational.com/blog/dimensional-vs.-vanguard#:~:text=Every%20DFA%20U.S.%20equity%20fund,a%20relative%20basis%20against%20Vanguard
[2] In January 2023, the MSCI AC World Value Index (USD, net div) returned 4.94%; the MSCI AC World Growth Index (USD, net div) returned 9.55%; the MSCI World Index (USD, net div) returned 7.08%; and the S&P500 returned 6.28%.
[3] In January 2023, the MSCI All Country World Index (SGD, net div) returned 5.02%.
Disclaimer:
While every reasonable care is taken to ensure the accuracy of information provided, no responsibility can be accepted for any loss or inconvenience caused by any error or omission. The information and opinions expressed herein are made in good faith and are based on sources believed to be reliable but no representation or warranty, express or implied, is made as to their accuracy, completeness or correctness. All investments carry risk. Expressions of opinions or estimates should neither be relied upon nor used in any way as indication of the future performance of any financial products, as prices of assets and currencies may go down as well as up and past performance should not be taken as indication of future performance. The author and publisher shall have no liability for any loss or expense whatsoever relating to investment decisions made by the reader.